Linux系统
Linux物理层
LSI Raid 阵列日常操作
MegaCLI基本使用指南
重要参数含义说明
Raid的增删改
Linux系统层
Linux 系统启动过程流程
timedatectl命令时间时区操作
sar命令用法
Linux 性能调优工具9张图
Linux 特殊权限说明
Linux系统三级等保整改脚本
CentOS 7 停止维护(EOL)后的仓库变动
Linux误删紧急救援
Linux下高效安全地批量删除文件的方法与实践
Linux网卡重命名实践指南
limits.conf 配置规范说明
iowait 接近 0 但系统严重卡顿的机制分析
RPM 包依赖查询详解
Linux查看主板内存槽与内存信息
安装麒麟Kylin-v10 Arm64版本到阿里云
CentOS7 多网卡单网关利用策略路由实现源进源出
初始化Linux数据盘(parted)
解决CentOS7下yum命令的异常
EXSI虚机mount出现‘unknown filesystem type 'LVM2_member'’
Linux虚机网卡单队列导致压测CPU无法满载的问题
Linux网络性能优化建议
Linux 修改系统语言环境
LInux文件系统中的默认保留空间 Ext4 vs. XFS
Linux CPU占用率原理与精确度分析
中标麒麟安装Nvidia显卡驱动
Linux主机双网卡同网段同网关配置
Linux 服务层
编译Expat 2.6.2的rpm包并升级
Linux主机挂载共享samba出现普通用户没有写权限的问题
编译OpenSSH 9.3p1的rpm包并升级
CentOS 7.x通过rpm升级OpenSSH到 8.5p1版本
Linux日志切割Logrotate原理和配置详解
systemd下配置sshd监听端口
编译NTP 4.2.8p17的rpm包并升级
编译OpenSSL 1.1.1w的rpm包并升级
linux命令集
磁盘工具集
Linux du 命令
fpsync数据迁移工具
字符处理集
Linux sed 命令
Linux命令输出重定向到变量
使用 paste 合并文件内容
常用调试指令集
编译cmake 3.5.2版本
网络工具集
MTR探测主机间丢包
Linux性能测试
甲骨文主机测试
本文档使用 MrDoc 发布
-
+
首页
Linux CPU占用率原理与精确度分析
# 1. CPU占用率计算原理 ## 1.1 相关概念 在 Linux/Unix 下,CPU 利用率分为 **用户态** 、 **系统态** 和 **空闲态** 分别表示 CPU 处于对应状态执行的时间 - **用户态** 用户态执行的时间 - **系统态** 系统内核执行的时间 - **空闲态** 和空闲系统进程执行的时间。 下面是几个与 CPU 占用率相关的概念。 - **CPU 利用率** : CPU 的使用情况。 - **用户时间(User time)** : 表示 CPU 执行用户进程的时间,包括 nices 时间。通常期望用户空间 CPU 越高越好。 - **系统时间(System time)** : 表示 CPU 在内核运行时间,包括 IRQ 和 softirq 时间。系统 CPU 占用率高,表明系统某部分存在瓶颈。通常值越低越好。 - **等待时间(Waiting time)** : CPI 在等待 I/O 操作完成所花费的时间。系统部应该花费大量时间来等待 I/O 操作,否则就说明 I/O 存在瓶颈。 - **空闲时间(Idle time)** : 系统处于空闲期,等待进程运行。 - **Nice 时间(Nice time)** : 系统调整进程优先级所花费的时间。 - **硬中断处理时间(Hard Irq time)** : 系统处理硬中断所花费的时间。 - **软中断处理时间(SoftIrq time)** : 系统处理软中断中断所花费的时间。 - **丢失时间(Steal time)** : 被强制等待(involuntary wait)虚拟 CPU 的时间,此时 hypervisor 在为另一个虚拟处理器服务。 下面是我们在 top 命令看到的 CPU 占用率信息及各项值含义。 ``` %Cpu(s): 1.3 us, 2.7 sy, 0.0 ni, 95.1 id, 0.0 wa, 0.8 hi, 0.1 si, 0.0 st us: User time sy: System time ni: Nice time id: Idle time wa: Waiting time hi: Hard Irq time si: SoftIrq time st: Steal time ```` ## 1.2 CPU占用率计算 Linux CPU 占用率计算,都是根据`/proc/stat` 文件内容计算而来,下面是 stat文件内容样例,内核版本不同,会稍有不同,但内容基本一致。 CPU 信息中,cpu行为总的信息,cpu0 ~ cpuX 为各个核的 CPU 信息 ``` [root@localhost ~]# cat /proc/stat cpu 7756762 91364 11728107 1105344369 9650 7835676 939786 0 0 0 cpu0 1918772 15877 2936881 276176813 2643 2014215 260070 0 0 0 cpu1 1947250 27962 2929967 276496444 2502 1931734 139599 0 0 0 ``` 上面共有 10 个值(**单位:ticks**),分别为: | cpu指标 | 含义 | 时间单位 | 备注 | |------------|-----------|---------|-------------------------------------------| | user | 用户态时间 | jiffies | 仅统计nice<=0,CPU 在用户态运行用户进程的时间| | nice | nice用户态时间 | jiffies | 低优先级,仅统计nice>0,CPU 在用户态运行用户进程的时间 | | system | 内核态时间 | jiffies | CPU 在系统态(内核)运行的时间,通常用于内核进程和内核任务 | | idle | 空闲时间 | jiffies | 不包含IO等待时间,CPU 空闲的时间,没有运行任何任务| | iowait | I/O等待时间 | jiffies | 硬盘IO等待时间 ,CPU 等待I/O操作完成的时间 | | irq | 硬中断时间 | jiffies | CPU 用于处理硬中断的时间 | | softirq | 软中断时间 | jiffies | CPU 用于处理软中断的时间 | | steal | 转换上下文时间 | jiffies | CPU 由于虚拟化或共享情况而被其他虚拟机"偷取"的时间 | | guest | 来宾时间 | jiffies | 运行在虚拟CPU上的用户态任务的时间 | | guest_nice | nice来宾时间 | jiffies | 运行在虚拟CPU上的用户态任务的时间,但是它们是以nice值为负数的进程 | **CPU 占用率计算公式如下:** ``` CPU 时间=user+system+nice+idle+iowait+irq+softirq+Stl %us=(User time + Nice time)/CPU 时间*100% %sy=(System time + Hard Irq time +SoftIRQ time)/CPU 时间*100% %id=(Idle time)/CPU 时间*100% %ni=(Nice time)/CPU 时间*100% %wa=(Waiting time)/CPU 时间*100% %hi=(Hard Irq time)/CPU 时间*100% %si=(SoftIRQ time)/CPU 时间*100% %st=(Steal time)/CPU 时间*100% ``` # 2 CPU占用率内核实现 下面以 RHEL6 内核源码版本 2.6.32-220.el6 x86\_64 为例,来介绍内核源码实现。/proc/stat 文件的创建由函数 proc\_stat\_init()实现,在文件 fs/proc/stat.c 中,在内核初始化时调用。/proc/stat 文件相关函数时间均在 stat.c 文件中。 对/proc/stat 文件的读写方法为 proc\_stat\_operations。 ```c++ 00152: static const **struct** file\_operations **proc\_ stat\_ operations** = { 00153: .open = **stat\_ open**, 00154: .read = **seq\_ read**, 00155: .llseek = **seq\_ lseek** , 00156: .release = **single\_ release**, 00157: }; ``` 打开文件函数 stat\_open(),函数首先申请大小为 size 的内存,来存放临时数据 (也是我们看到的 stat 里的最终数据)。 ```c++ 00128: static int stat_open(struct inode *inode, struct file *file) 00129: { 00130: unsigned size = 4096 * (1 + num_ possible_ cpus() / 32); 00131: char *buf; 00132: struct seq_file *m; 00133: int res; 00134: 00135: / * don't ask for more than the kmalloc() max size, currently 128 KB */ 00136: if (size > 128 * 1024) 00137: size = 128 * 1024; 00138: buf = kmalloc(size, GFP_KERNEL); 00139: if (! buf) 00140: return - ENOMEM; 00141: 00142: res = single_ open(file, show_ stat, NULL); 00143: if (! res) { 00144: m = file- >private_data; 00145: m- >buf = buf; 00146: m- >size = size; 00147: } else 00148: kfree(buf); 00149: return res; 00150: } ? end stat_open ? 00151: ``` /proc/stat 文件的数据由show\_stat()函数填充。注意42 行for\_each\_possible\_cpu(i)循环,是累加计算所有 CPU 的数据,如我们前面的示例看到的/proc/stat 文件中第一行cpu 值。 ``` cpu 7756762 91364 11728107 1105344369 9650 7835676 939786 0 0 0 ``` ```c++ 00025: static int show _ stat(struct seq_file *p, void *v ) 00026: { 00027: int i, j ; 00028: unsigned long jif; 00029: cputime64_t user, nice, system, idle, iowait, irq, softirq,steal; 00030: cputime64_t guest; 00031: u64 sum = 0; 00032: u64 sum_ softirq = 0; 00033: unsigned int per_ softirq_ sums[NR_SOFTIRQS] = { 0}; 00034: struct timespec boottime; 00035: 00036: user = nice = system = idle = iowait = 00037: irq = softirq = steal = cputime64_zero; 00038: guest = cputime64_zero; 00039: getboottime(&boottime); 00040: jif = boottime.tv_sec; 00041: 00042: for_ each_ possible_ cpu(i) { 00043: user = cputime64_ add(user, kstat_ cpu(i).cpustat.user); 00044: nice = cputime64_ add(nice, kstat_ cpu(i).cpustat.nice); 00045: system = cputime64_ add(system,kstat_ cpu(i).cpustat.system); 00046: idle = cputime64_ add(idle, kstat_ cpu(i).cpustat.idle); 00047: idle = cputime64_ add(idle, arch_ idle_ time(i)); 00048: iowait = cputime64_ add(iowait,kstat_ cpu(i).cpustat.iowait); 00049: irq = cputime64_ add(irq, kstat_ cpu(i).cpustat.irq); 00050: softirq = cputime64_ add(softirq,kstat_ cpu(i).cpustat.softirq); 00051: steal = cputime64_ add(steal, kstat_ cpu(i).cpustat.steal); 00052: guest = cputime64_ add(guest,kstat_ cpu(i).cpustat.guest); 00053: sum += kstat_ cpu_ irqs_ sum(i); 00054: sum += arch_ irq_ stat_ cpu(i); 00055: 00056: for (j = 0; j < NR_SOFTIRQS; j++ ) { 00057: unsigned int softirq_ stat = kstat_ softirqs_ cpu(j, i); 00058: 00059: per_softirq_sums[j] += softirq_stat; 00060: sum_softirq += softirq_stat; 00061: } 00062: } 00063: sum += arch_ irq_ stat(); 00064: 00065: seq_ printf(p,"cpu %llu %llu %llu %llu %llu %llu %llu %llu %llu\n", 00066: (unsigned long long)cputime64_ to_ clock_ t(user), 00067: (unsigned long long)cputime64_ to_ clock_ t(nice), 00068: (unsigned long long)cputime64_ to_ clock_ t(system), 00069: (unsigned long long)cputime64_ to_ clock_ t(idle), 00070: (unsigned long long)cputime64_ to_ clock_ t(iowait), 00071: (unsigned long long)cputime64_ to_ clock_ t(irq), 00072: (unsigned long long)cputime64_ to_ clock_ t(softirq), 00073: (unsigned long long)cputime64_ to_ clock_ t(steal), 00074: (unsigned long long)cputime64_ to_ clock_ t(guest)); ``` 计算总的CPU各个值user、nice、system、idle、iowait、irq、softirq、steal后, 就分别计算各个CPU的使用情况(75~100行)。 ```c++ 00075: for_ each_ online_ cpu(i) { 00076: 00077: /*Copyvaluesheretoworkaroundgcc-2.95.3,gcc-2.96*/ 00078: user = kstat_ cpu(i).cpustat.user; 00079: nice = kstat_ cpu(i).cpustat.nice; 00080: system = kstat_ cpu(i).cpustat.system; 00081: idle = kstat_ cpu(i).cpustat.idle; 00082: idle = cputime64_ add(idle, arch_ idle_ time(i)); 00083: iowait = kstat_ cpu(i).cpustat.iowait; 00084: irq = kstat_ cpu(i).cpustat.irq; 00085: softirq = kstat_ cpu(i).cpustat.softirq; 00086: steal = kstat_ cpu(i).cpustat.steal; 00087: guest = kstat_ cpu(i).cpustat.guest; 00088: seq_ printf(p, 00089: "cpu%d %llu %llu %llu %llu %llu %llu %llu %llu %llu\n", 00090: i, 00091: (unsigned long long)cputime64_ to_ clock_ t(user), 00092: (unsigned long long)cputime64_ to_ clock_ t(nice), 00093: (unsigned long long)cputime64_ to_ clock_ t(system), 00094: (unsigned long long)cputime64_ to_ clock_ t(idle), 00095: (unsigned long long)cputime64_ to_ clock_ t(iowait), 00096: (unsigned long long)cputime64_ to_ clock_ t(irq), 00097: (unsigned long long)cputime64_ to_ clock_ t(softirq), 00098: (unsigned long long)cputime64_ to_ clock_ t(steal), 00099: (unsigned long long)cputime64_ to_ clock_ t(guest)); 00100: } ``` 104 行计算所有 CPU 上中断次数,104~105 行计算 CPU 上每个中断向量的中断次数。注意:/proc/stat 文件中,将所有可能的 NR\_IRQS 个中 断向量计数都记录下来,但我们的机器上通过只是用少量的中断向量,这就是看到/proc/stat文件中,intr 一行后面很多值为 0 的原因。 show\_stat()函数最后获取进程切换次数 nctxt、内核启动的时间 btime、所有创建的进程 processes、正在运行进程的数量 procs\_running、阻塞的进程数量 procs\_blocked 和所有 io 等待的进程数量。 ```c++ 00101: seq_ printf(p, "intr %llu", (unsigned long long)sum); 00102: 00103: /*sumagain?itcouldbeupdated?*/ 00104: for_ each_ irq_ nr(j) 00105: seq_ printf(p, " %u", kstat_ irqs(j)); 00106: 00107: seq_ printf(p, 00108: "\nctxt %llu\n" 00109: "btime %lu\n" 00110: "processes %lu\n" 00111: "procs_running %lu\n" 00112: "procs_blocked %lu\n", 00113: nr_ context_ switches(), 00114: 00115: (unsigned long)jif,total_ forks , 00116: nr_ running (), 00117: nr_ iowait()); 00118: 00119: seq_ printf(p, "softirq %llu", (unsigned long long)sum_softirq); 00120: 00121: for (i = 0; i < NR_SOFTIRQS; i++ ) 00122: seq_ printf(p, " %u", per_softirq_sums[i]); 00123: seq_ printf(p, "\n"); 00124: 00125: return 0; 00126: } ? endshow_stat? 00127: ``` # 3 Linux CPU占用率精确性分析 在使用类似 top 命令,观察系统及各进程 CPU 占用率时,可以指定刷新时间间隔, 以及时刷新和实时观察 CPU 占用率。 top 命令默认情况下,是每 3 秒刷新一次。也可以通过 top -d < 刷新时间间隔> 来指定刷新频率,如 top -d 0.1 或 top -d 0.01 等。top 执行时,也可以按“s”键,修改时间间隔。 我们可以将 CPU 占用率刷新间隔设置很低,如 0.01 秒。但过低的刷新频率是否能够更准确观察到 CPU 占用率?Linux 系统提供的 CPU 占用率信息是否足够精确? 根据前面分析,我们已知 Linux 是根据/proc/stat 文件的内容来计算 CPU 占用率,也 就是精确度和/proc/stat 提供的数据精确度有关。那么 - (1)/proc/stat 文件中的内容单位是什么? - (2)多久会刷新/proc/stat 中的数据? ``` cpu 7756762 91364 11728107 1105344369 9650 7835676 939786 0 0 0 cpu0 1918772 15877 2936881 276176813 2643 2014215 260070 0 0 0 ``` ## 3.1 /proc/stat中的数据单位精度 /proc/stat 中 CPU 数据信息,单位是 **ticks**。内核中有个全局变量 jiffies,来记录系 统启动以来,经历的 ticks 数量。 ``` cpu0 1918772 15877 2936881 276176813 2643 2014215 260070 0 0 0 ``` ticks(滴答)就是系统时钟中断的时间间隔,该值与内核中 HZ 值有关,即 ticks = 1/HZ。HZ 值的大小,在内核编译时可配置的。某台机器上是 RHEL6.1 内核,配置的HZ 值为 1000。 ``` [root@nginx1 ~]# uname -a Linux nginx1 3.10.0-1160.el7.x86_64 #1 SMP Mon Oct 19 16:18:59 UTC 2020 x86_64 x86_64 x86_64 GNU/Linux [root@nginx1 ~]# [root@nginx1 ~]# cat /boot/config-3.10.0-1160.92.1.el7.x86_64 |grep CONFIG\_HZ # CONFIG_HZ_PERIODIC is not set # CONFIG_HZ_100 is not set # CONFIG_HZ_250 is not set # CONFIG_HZ_300 is not set CONFIG_HZ_1000=y CONFIG_HZ=1000 [root@nginx1 ~]# ``` HZ 的值,就是每秒的时钟中断数量。可以观察/proc/interrupts 中时钟中断值变化, 来计算 HZ 的值。当 HZ 的值为 1000 时,ticks 的单位即为 1/1000 秒,即 1ms。 ## 3.2 CPU利用率统计信息更新 在时钟中断程序中,更新 CPU 利用信息,即每个 ticks 更新一次。include/linux/kernel\_stat.h 中,有相应函数接口,专门用来更新 CPU 利用率信息。如account\_user\_time()是更新用户态 CPU 信息。 ```c++ 00111: / * 00112: * Lock/ unlock the current runqueue - to extract task statistics: 00113: */ 00114: extern unsigned long long task_delta_exec(struct task_ struct *); 00115: 00116: extern void account_user_time(struct task_ struct *,cputime_ t, cputime_ t); 00117: extern void account_system_time(struct task_ struct *, int, cputime_ t, 00117: cputime_ t); 00118: extern void account_steal_time(cputime_ t); 00119: extern void account_idle_time(cputime_ t); 00120: 00121: extern void account_process_tick(struct task_ struct *,int user); 00122: extern void account_steal_ticks(unsigned long ticks); 00123: extern void account_idle_ticks(unsigned long ticks); ``` 在内核中有一个 per CPU 变量 kernel_stat,专门用来记录 CPU 利用信息。其定义在 include/linux/kernel_stat.h 中。 ```c++ 00039: DECLARE_PER_CPU(struct kernel_ stat, kstat); 00040: 00041: #define kstat_ cpu(cpu) per_ cpu(kstat, cpu) ``` 每次时钟中断时(ticks),就会更新 kernel\_stat 变量中各个成员变量的值。/proc/stat文件中的值,都是在程序读取时更新,内核并不会主动更新/proc/stat 中的数据。/proc/stat 中的 CPU 信息是通过 kernel\_stat 各个成员变量的值计算而来。 ## 3.3 CPU利用率精确性分析 通过前面分析,我们可以得出以下结论: - (1)Linux CPU 占用率是根据/proc/stat 文件中的数据计算而来; - (2)/proc/stat 中的数据精度为 ticks,即 1/HZ 秒; - (3)内核每个 ticks 会更新一次 CPU 使用信息; - (4)CPU 占用率的精度为 1/HZ 秒。 # 4 Linux CPU占用率是否准确 有时偶尔会遇到类似问题:在稳定计算压力下,进程 CPU 占用率不稳定;或者特性进程 CPU 占用率明显不准。即在系统切换次数很高时,Linux 的 CPU 利用率计算机制可能不准确。 那么 Linux 的 CPU 利用率计算到底是否准确?若可能不准确,则什么情况下出现这 种情况? ## 4.1 Linux CPU占用率不准确情形 在前面分析中,Linux 内核是在每次时钟中断时更新 CPU 使用情况,即 1/HZ 秒更新一次。时钟中断时,只会看到当前正在运行的进程信息。以下图为例,红色箭头表示时钟中断(Timer Interrupt)。 第一次中断时,看到进程 A 在运行。但进程 A 运行时间短,进程 B 运行。第二次中断时,进程 C 运行;在第三次中断到来时,再次调度进程 A 执行。第三次此中断时,进程 C 运行。 按照 Linux 内核 CPU 占用率统计方法,在第 1 次和第 2 次中断期间,内核并没有看到进程 B 在运行;于是就漏掉了进程 B 使用 CPU 的信息。同样道理,在第 2 次和第 3次中断期间,漏掉了进程 B 使用 CPU 的情况。这样,就导致了 Linux 内核 CPU 占用率统计不准确。 **发生 CPU 占用率不准确的原因**是:==在一个时钟中断周期内,发生了多次进程调度==。 时钟中断的精度是 1/HZ 秒。  ## 4.2 top命令CPU使用率准确吗? 只有在一个时钟中断周期内发生多次进程调度,才会出现 CPU 占用率不准的情况。 那么 top 命令中 CPU 使用率是否准确与进程调度频率有关。 若 HZ 的值为 250,则 ticks 值为 4ms;若 HZ 值为 1000,则 ticks 值为 1ms。在 HZ为 250 时,只要进程的调度间隔大于 4ms,CPU 占用率就准确。HZ 为 1000 时,调度间隔大于 1ms,CPU 占用率计算就准确。 **进程调度次数少,CPU 占用率就准确;调度时间间隔小于时钟中断,就可能不准确**。 那么进程调度的时机是怎样的?如何观察进程调度次数? ### 4.2.1 进程调度时机 - 进程状态转换的时刻:进程终止、进程睡眠 进程要调用 sleep()或 exit()等函数进行状态转换,这些函数会主动调用调度程序进行进程调度; - 当前进程的时间片用完时(current->counter=0)由于进程的时间片是由时钟中断来更新的 - 设备驱动程序 当设备驱动程序执行长而重复的任务时,直接调用调度程序。在每次反复循环中,驱动程序都检查 need\_resched 的值,如果必要,则调用调度程序 schedule()主动放弃CPU。 - 进程从中断、异常及系统调用返回到用户态时 不管是从中断、异常还是系统调用返回,最终都调用 ret\_from\_sys\_call(),由这个函数进行调度标志的检测,如果必要,则调用调度程序。那么,为什么从系统调用返回时要调用调度程序呢?这当然是从效率考虑。从系统调用返回意味着要离开内核态而返回到用户态,而状态的转换要花费一定的时间,因此,在返回到用户态前,系统把在内核态该处理的事全部做完。 ### 4.2.2 进程调度次数观察 可以通过 vmstat 命令,来观察系统中进程切换次数,cs 域的值就是切换次数。HZ 的值,可以通过内核配置文件来确定,若/proc/config.gz 存在,导出这个文件查看即可。 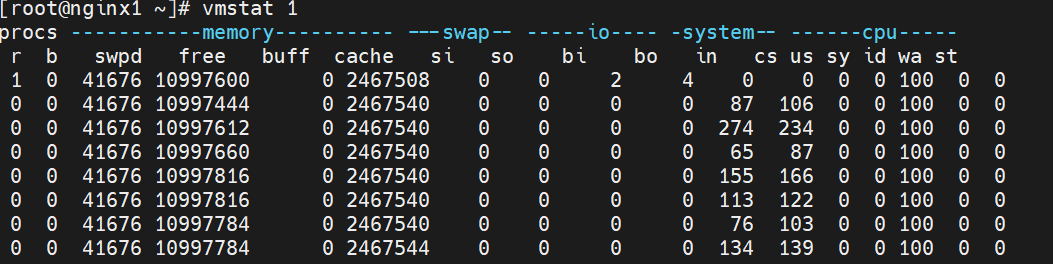 也可以通过查看/proc/sched\_debug 文件内容,来观察切换次数(nr\_switches)。 ``` [root@nginx1 ~]# watch -d -n 1 'cat /proc/sched\_debug |grep nr\_switches' ``` 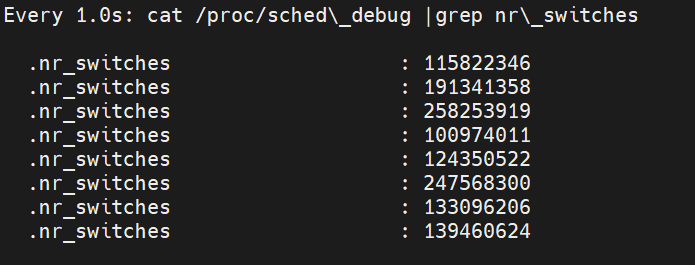 我们系统中的进程调度真的那么频繁吗?大多数情况下,Linux 中的 CPU 占用率计算机制是准确的。 **引用** \[1] [Linux CPU占用率原理与精确度分析][1] [1]: http://ilinuxkernel.com/ " Linux CPU占用率原理与精确度分析"
Nathan
2023年10月26日 11:09
转发文档
收藏文档
上一篇
下一篇
手机扫码
复制链接
手机扫一扫转发分享
复制链接
Markdown文件
PDF文件
Docx文件
分享
链接
类型
密码
更新密码